Apply Grouping and Aggregate Functions to a Dataset
The Analysis Group By provider in Data Sync takes a number of Data Sync project files as the source Data and applies grouping and aggregate functions to the results.
Getting Started
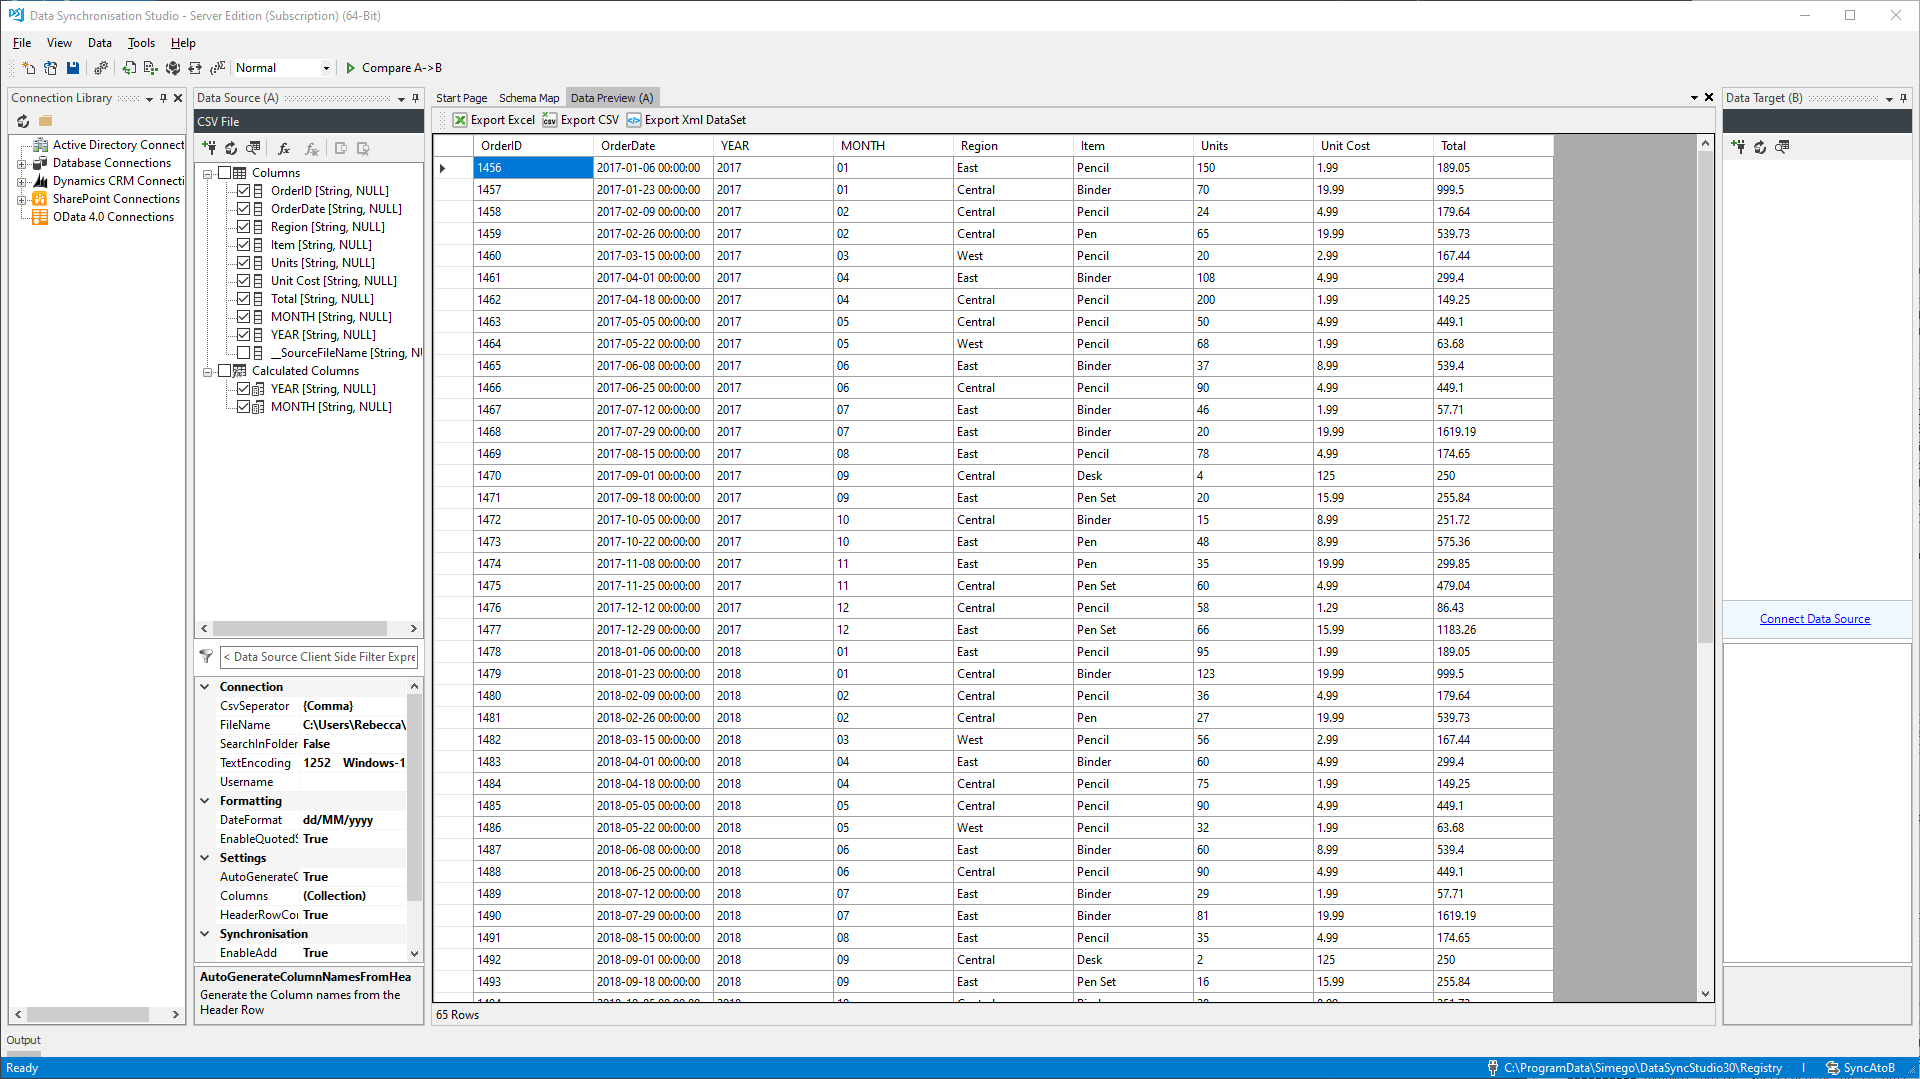
To get started, create your source data project and create any extra columns that you may need for the grouping. For example in the Sales Data example we have created a Calculated Column for Year and Month from the dateSold column.

Create Grouping Project
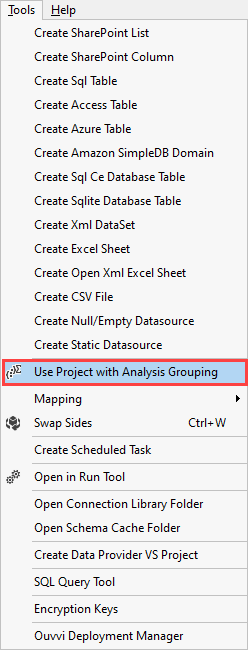
To use this project as the source we then either create a new project and select this project as the source, or we can go to Tools > Use Project with Analysis Grouping.

Define the Groups and Value Columns
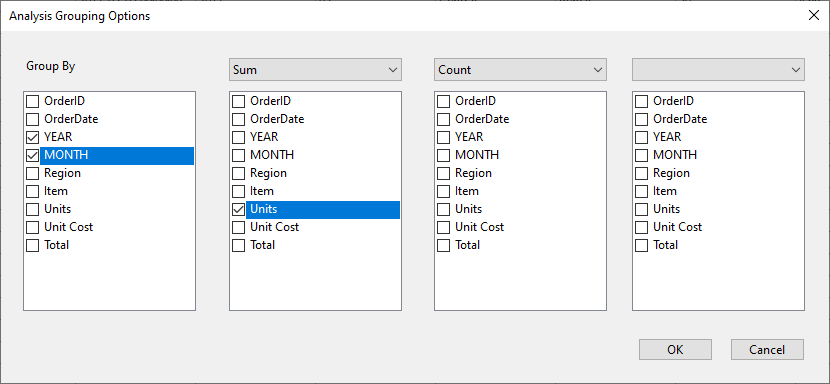
You now need to define the group/s and value columns. This is where Data Sync will group the rows, you can use multiple columns that define the group. In this example we have grouped by Year and Month, and returned the SUM of the units sold for each month within those years.

View the Results
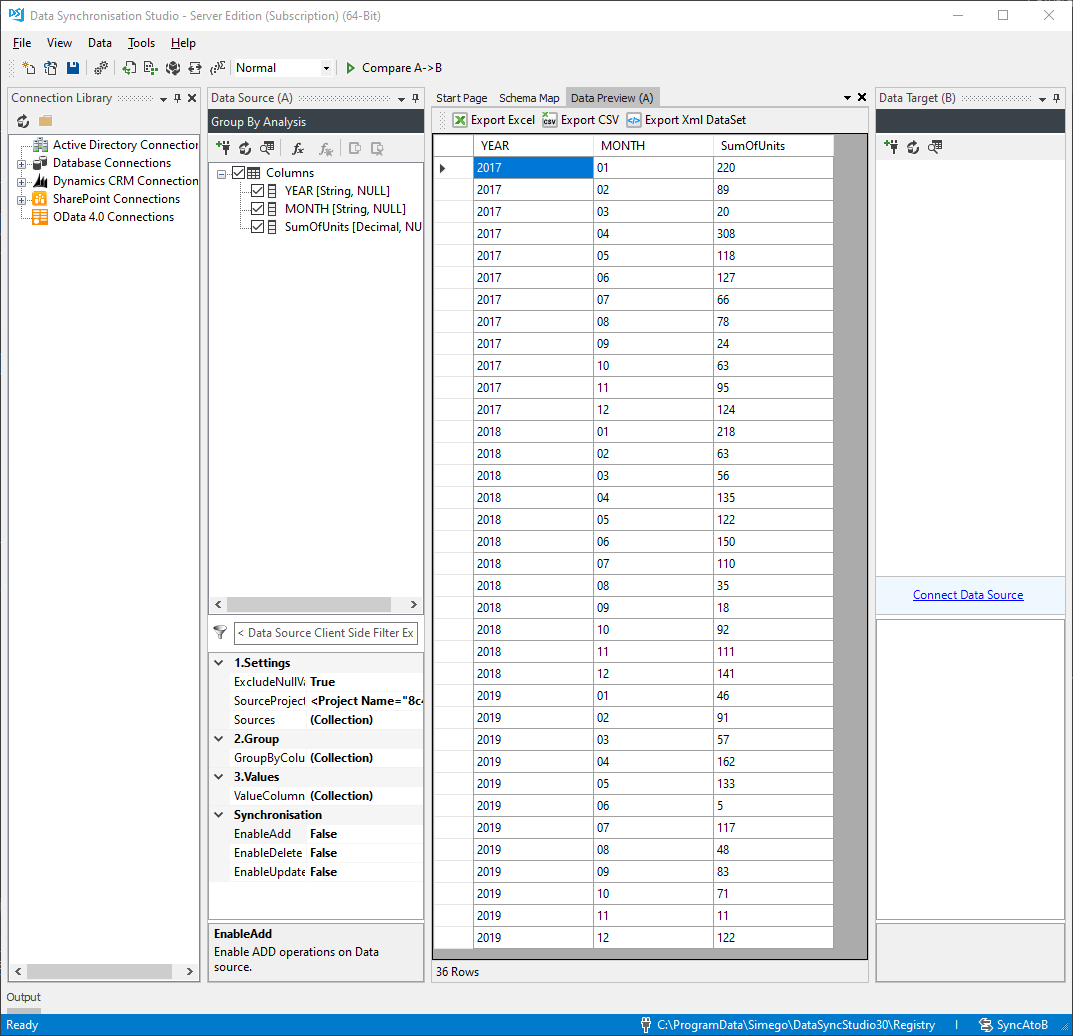
Clicking OK creates a new project with the current project as the source of the data, with the groups and value columns as the columns.
You can now use this as a Data source and normal and map the results to your target or simply export the results.

